(04) Systems / Case study
aria-er
The numbers match ARPAE's.
aria-er is a data platform on air quality in Emilia-Romagna: ARPAE open data and Open-Meteo weather, from ingestion to dashboard. This page shows how it is built and how its results were checked.
- Started
- September 2026
- Version
- 1.2.0, October 2026
- Team
- One developer
- Code
- Public, MIT
Rust · dbt · DuckDB · BigQuery · Dagster · Streamlit · Terraform · Docker
The problem
ARPAE publishes the air quality measurements of Emilia-Romagna as open data, but not in a form you can ask questions of: hourly and daily values spread over several services, provisional for weeks and then corrected, station ids that change from one file to the next.
The questions are simple: how often each station exceeded the legal limits, whether the air is getting better, how much traffic adds to background pollution, how wind and rain drive PM10. Answering them with numbers that can be trusted is the work.
Constraints
- Recent values are corrected for weeks: every run reprocesses a 30-day window and upserts by station, pollutant and hour. Running the same window twice gives the same files.
- Timestamps are stored in UTC; days and years are counted in UTC+1 all year round, as ARPAE does.
- Legal limits live in a seed, never in the SQL of a model.
- Negative or impossible values are flagged, not dropped.
- The same models run on DuckDB on a laptop and on BigQuery in the cloud.
Architecture
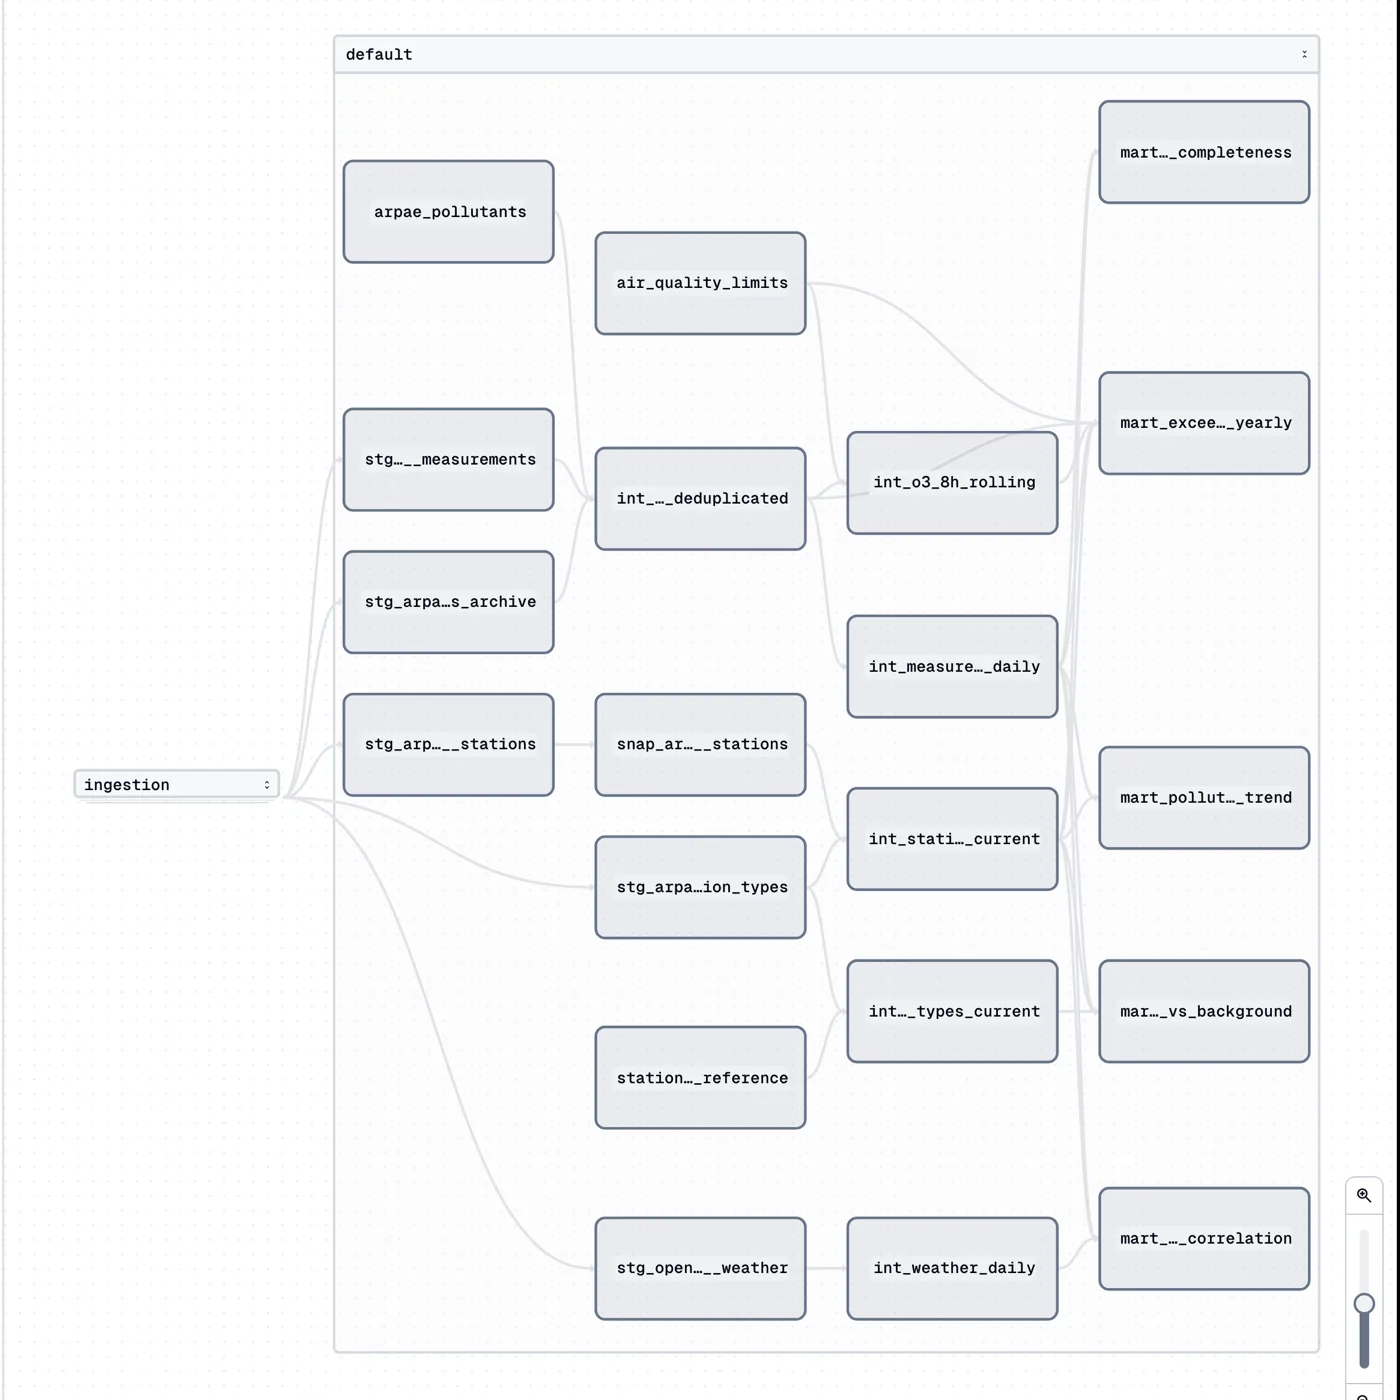
Four components, each with one job, joined by files and tables rather than calls: a Rust binary writes partitioned Parquet, dbt turns it into tested marts, Dagster schedules and checks both, and a dashboard only reads the marts. Each row depends only on the rows below it.
dashboard
Streamlit: one filtered query per mart, no business logic.
orchestration
Dagster: daily schedule, monthly partitions, backfills, checks on freshness and completeness.
transform
dbt: staging, intermediate and marts, with more than a hundred tests.
aq-ingest
Rust workspace: ARPAE and Open-Meteo clients behind a source trait, retries with backoff.
raw/
Parquet partitioned by year and month, each partition rewritten atomically, on disk or in Cloud Storage.
One command starts it all with Docker on a laptop; the cloud target writes to Cloud Storage and builds the same models in BigQuery.
One day of data, end to end
The daily refresh:
- 01Dagster
At the scheduled hour it starts the refresh of the current month, one run at a time.
- 02Ingestor
It downloads the last 30 days from the ARPAE archive and the weather from Open-Meteo, and rewrites each month it touched as one Parquet file.
- 03dbt
It normalises units, drops duplicates, merges the new rows and rebuilds the marts. A failing test stops the run.
- 04Dagster
Its checks warn when the newest value is older than 48 hours or when completeness drops.
- 05Dashboard
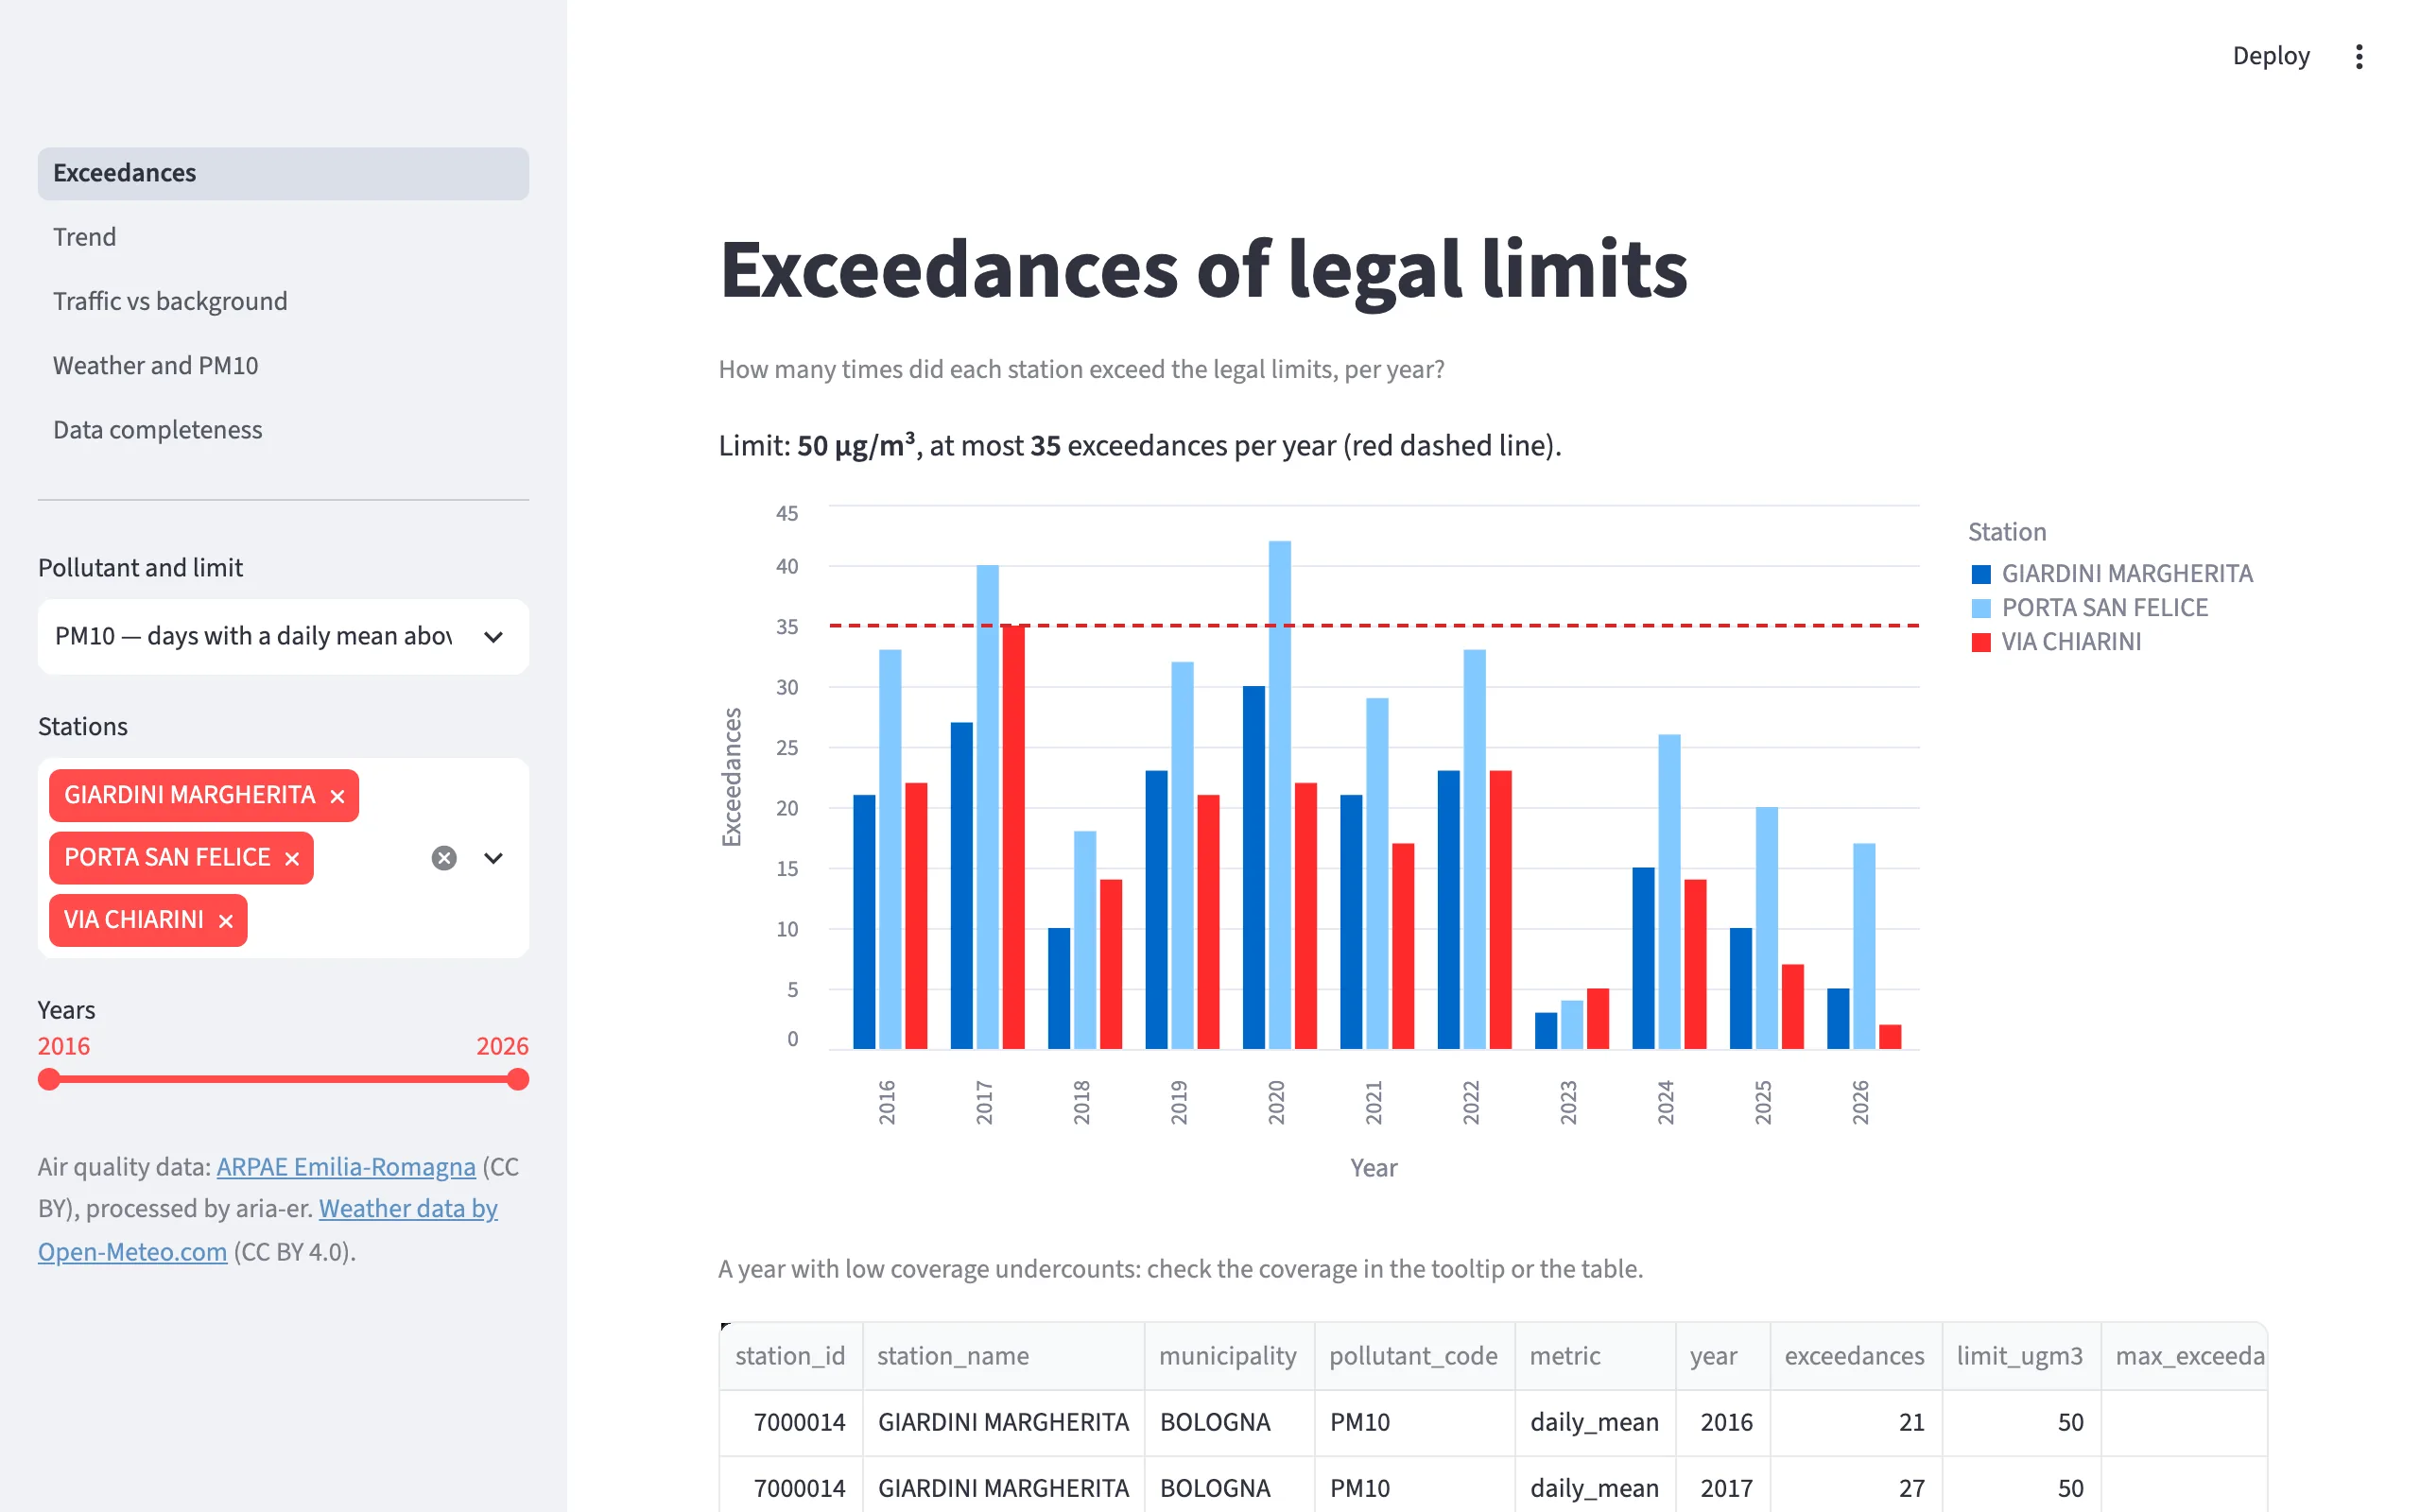
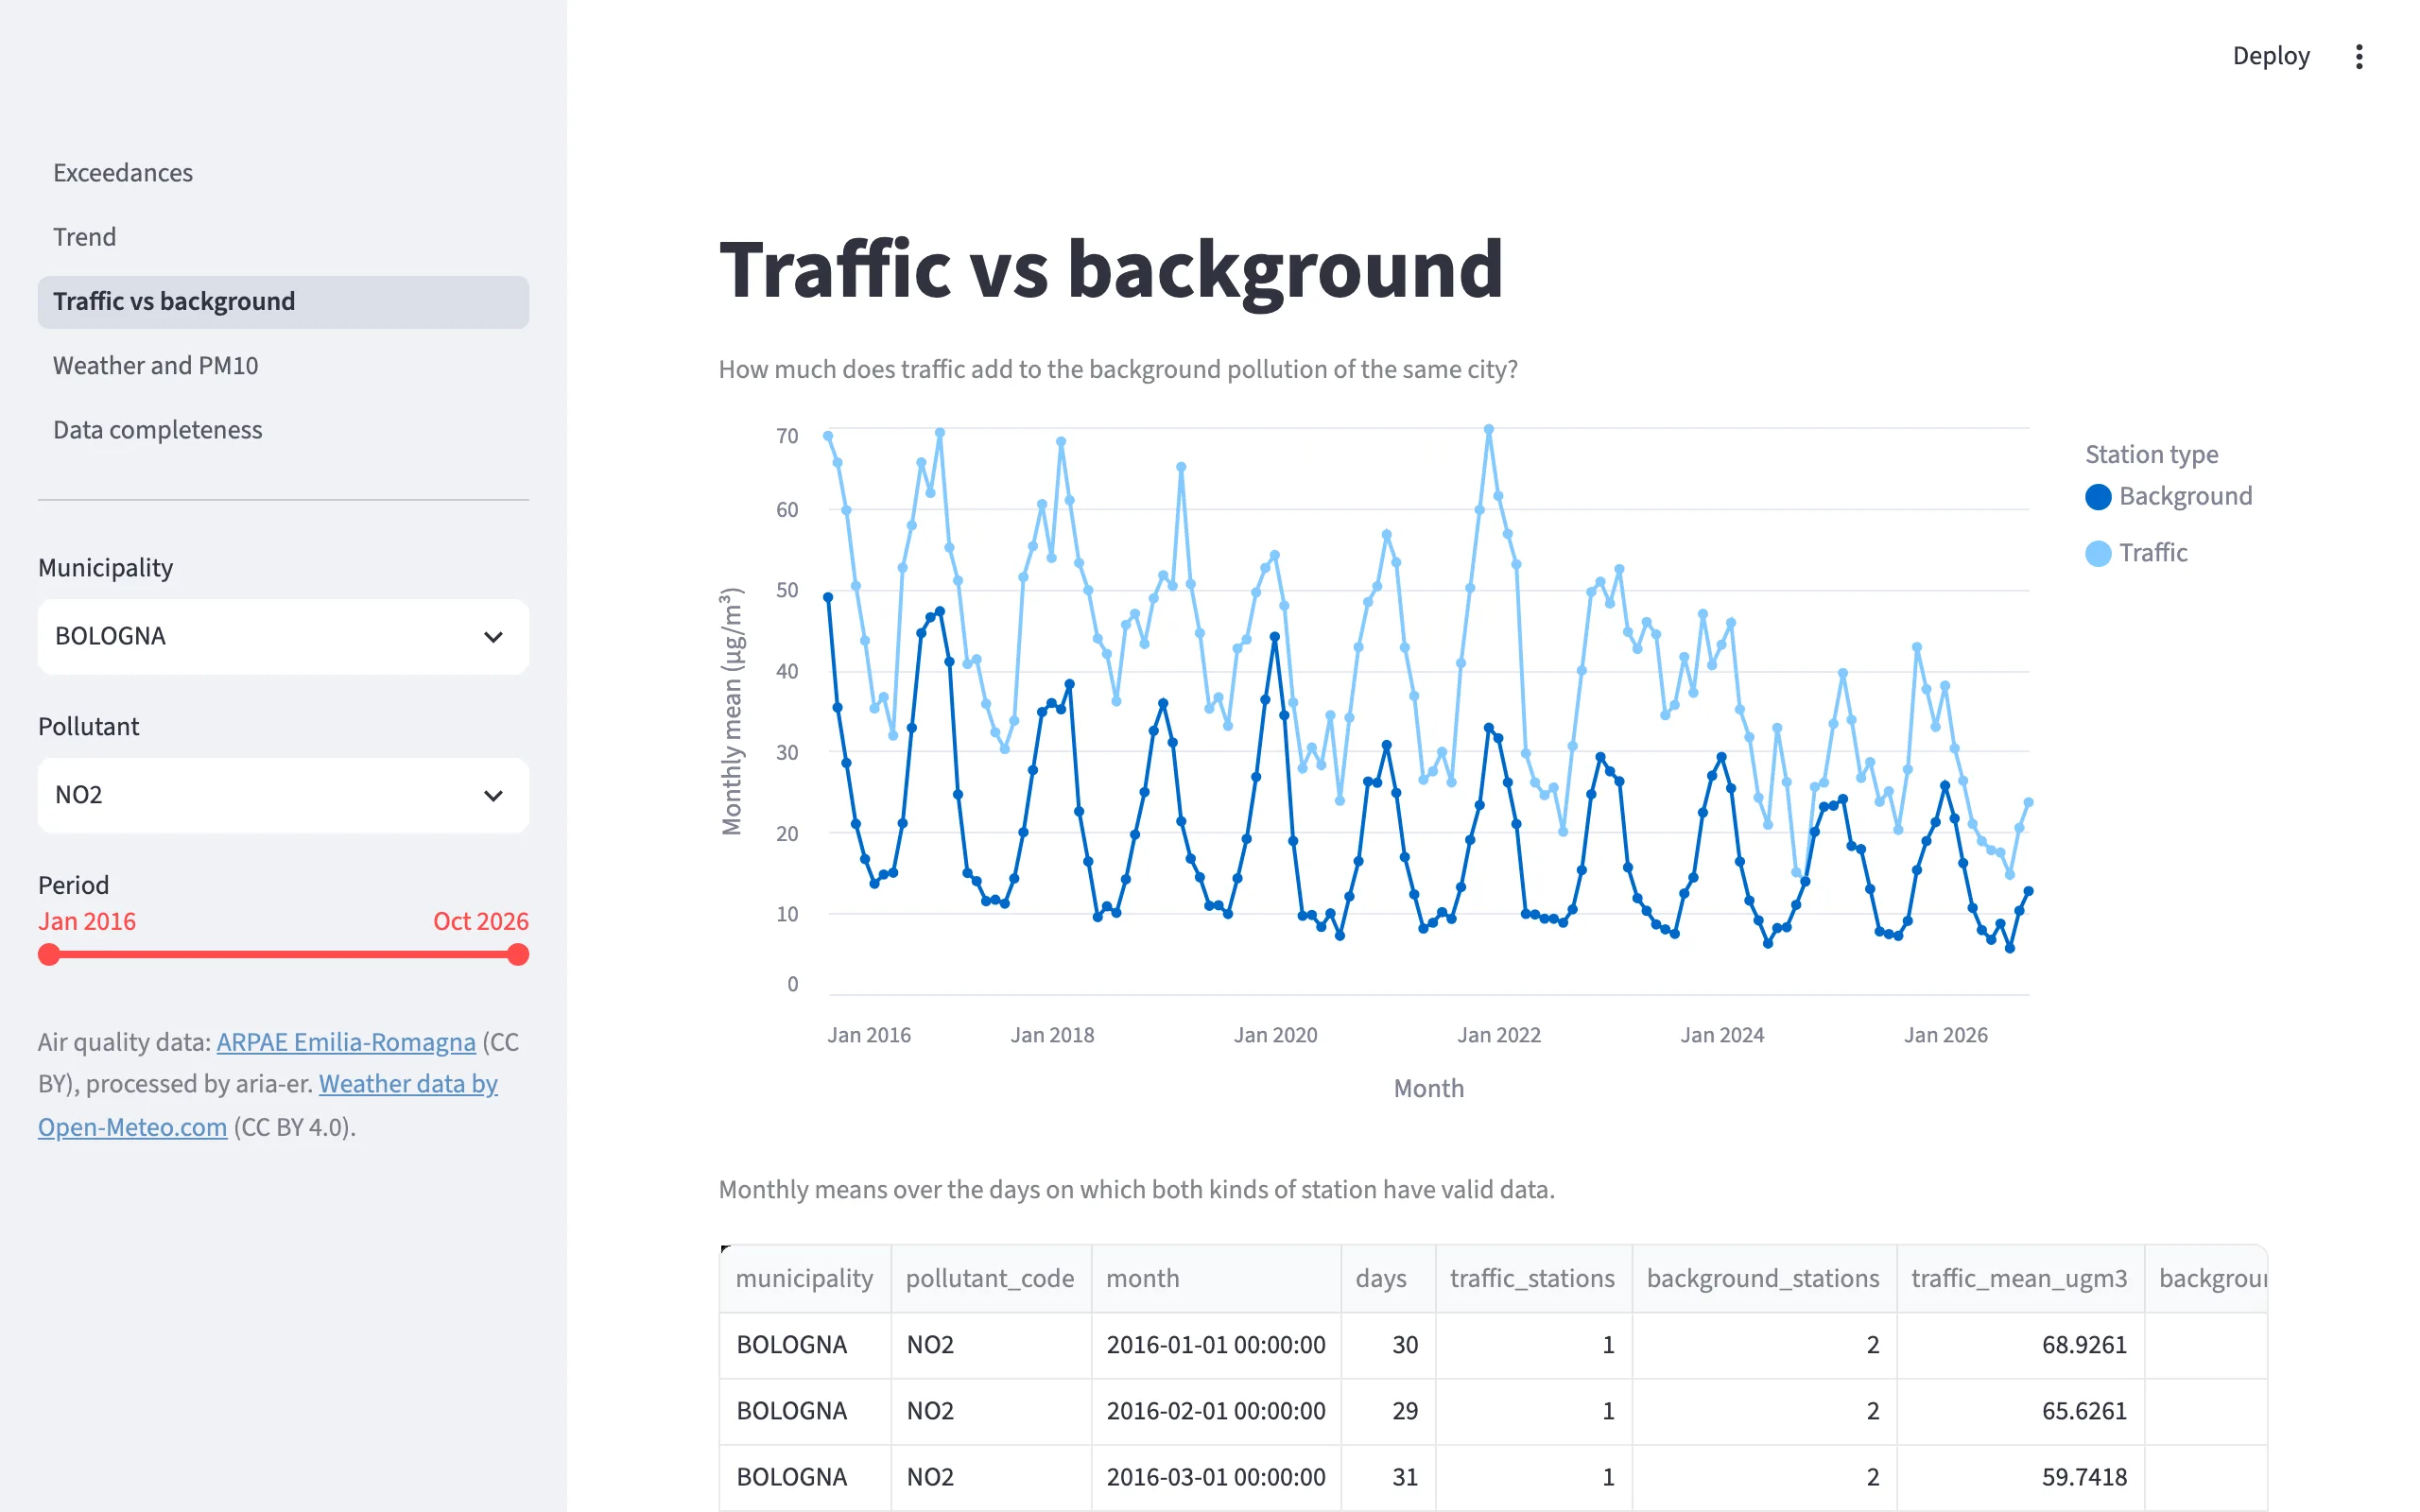
It reads the marts: exceedances, trends, traffic against background, weather, completeness.
Decisions and trade-offs
- 01
Rewrite a partition, never append
Each month is one Parquet file, rewritten whole with the merged rows and swapped in atomically. Rerunning a window gives the same bytes; the price is rewriting a month to change one hour, cheap at this size.
- 02
The legal rules, not a plain mean
A day counts only with 18 valid hours, the value is rounded before it is compared with the limit, the day runs in UTC+1. Leaving out any one of them made the counts differ from ARPAE's.
- 03
Flag, don't drop
Negative, zero and implausible values stay in the data with a flag and out of the aggregates. Two warning tests keep them visible instead of silently gone.
- 04
One set of models, two warehouses
The SQL that differs between DuckDB and BigQuery lives in a few macros. An emulator checks the BigQuery version on every pull request, and the run on a real Google Cloud project gave identical marts.
- 05
No streaming
The sources publish hours after measuring and revise for months, and every question is daily or coarser. A daily batch answers them; streaming would only add moving parts.
Checked against ARPAE
Every count of exceedances was compared with what ARPAE publishes itself. Two of the checks changed the code: PM10 matched only once the daily value was rounded before the comparison, and ozone matched for 29 stations out of 43 until the 8-hour windows were computed on every hour, missing ones included.
| Indicator | ARPAE | aria-er |
|---|---|---|
| PM10 days above 50 µg/m³, Porta San Felice, 2025mart_exceedances_yearly | 20 | 20 |
| Ozone days above 120 µg/m³, Via Chiarini, 2025mart_exceedances_yearly | 54 | 54 |
| Stations with the same PM10 exceedance days in 2026mart_exceedances_yearly | 64 | 64 |
| Stations with the same ozone exceedance days in 2026mart_exceedances_yearly | 43 | 43 |
Results, live
The charts below read the export that aria-er publishes every morning on GitHub Pages: the same marts as the dashboard, refreshed by the pipeline itself.
Loading the latest data…
Dashboard and pipeline
What comes next
- A daily export of the marts published by the pipeline, to show live results on this page.
- Ozone exceedances averaged over three years, as the law asks, once three full years are loaded.
- Loading the archive into a native BigQuery table, should it outgrow the free tier of reads.
Code
The repository is public under the MIT licence. One command starts the whole stack with Docker and loads ten years of data.